The GDN Status Monitor Dashboard gives you visibility into how Smartling’s Global Delivery Network (GDN) proxy is performing for your localized websites. This guide explains the metrics shown on the Status Monitor pages, what the numbers mean, and how to interpret them for your specific setup.
Interpreting and evaluating metrics
There is no universal set of "good" numbers that applies to every account. What is considered healthy for a high-traffic enterprise site with dozens of domains may look very different from a smaller site serving only a few localized markets. However, this guide provides general benchmark ranges for each metric to give you a starting point for evaluating your own performance. These ranges are based on analysis of actual GDN customer data and typical GDN customer profiles — use them as orientation, not as strict thresholds.
The health and speed of your source site are critical factors and are not controlled by Smartling. Because the GDN is a proxy, it acts as an intermediary between your source site and the localized site. Many of the metrics shown in the Status Monitor — including upstream response time, HTTP response codes, and the largest component of total request time — are a direct reflection of your own infrastructure's behavior.
How to read each metric section: Each metric below includes a summary of what it measures and what to look for, followed by a more detailed breakdown of the factors that influence it and how to interpret changes over time. If you are looking for a quick assessment, start with the summary. If you are investigating a specific change, read the full section.
Time Periods and Comparisons
The Status Monitor dashboard allows you to view metrics across three time periods: 24 hours, 7 days, and 30 days. All metrics and response code data are available for all three periods.
Choose the time period based on what you're trying to understand:
- 24 hours: Best for checking current operational status. Use this when you want to know if something is happening right now — an active incident, a traffic spike, or an ongoing outage.
- 7 days: Best for spotting recent trends. Use this to identify changes over the past week, such as a gradual increase in response times or a shift in traffic patterns after a deployment.
- 30 days: Best for understanding your baseline. Use this to assess overall performance, identify long-term patterns, and evaluate whether a metric is within its normal range for your site.
How trend comparisons work: The percentage change shown for each metric (e.g., "+24.51% vs last month") compares the selected time period to the immediately preceding period of the same length. If you are viewing the 30-day view, the trend compares the last 30 days to the 30 days before that. If you are viewing the 7-day view, it compares the last 7 days to the previous 7 days. The same applies to the 24-hour view.
This means the same metric can show different trend directions depending on the time period selected. A metric that spiked three days ago may show a large increase in the 7-day view but appear stable in the 30-day view if the spike is small relative to the full month. When investigating a change, it can be helpful to check multiple time periods to understand both the immediate situation and the broader context.
Requests
The total number of HTTP requests routed through the GDN proxy in the past 24 hours.
What it tells you: This is a baseline indicator of traffic volume. The request count includes every HTTP request that passes through the GDN proxy, regardless of response code — successful page loads, redirects, client errors, and server errors are all counted. Traffic sources include end-user visits, bot and crawler activity (search engines, monitoring tools, scrapers), internal tools accessing localized URLs, and the GDN Crawler if configured.
Large swings in either direction are worth investigating. A significant drop could indicate a DNS change, CDN misconfiguration, or network issue preventing traffic from reaching the GDN. A large spike could indicate bot activity, a content event driving organic traffic, or a misconfigured crawler. If a spike is unexpected, your CDN or WAF logs may help identify whether the source is bot or human traffic.
What is a good number: This metric is relative. A drop in requests is not inherently bad and may reflect normal variation, such as weekend or seasonal patterns. Establish your own baseline over time and investigate significant deviations rather than comparing against a universal benchmark.
AVG Total Request Time
The average time, in milliseconds, to fully process and respond to a request as measured by the GDN proxy. This includes both Proxy Overhead and Upstream Response.
What it tells you: This is the primary end-to-end latency metric for your localized pages. Rising average request times may indicate slower page loads for users.
What is a good number: This depends heavily on your origin server performance and audience geography.
As a general guideline:
| Total Request Time | General Assessment |
|---|---|
| Under 100ms | Excellent — fast origin server with efficient proxy processing |
| 100–500ms | Good — typical for most content-rich websites |
| 500ms–1s | Acceptable — may indicate a slower origin server or complex content processing |
| Over 1s | Worth investigating — check upstream response time first, as this is most commonly the driver |
These ranges are general web performance guidelines. Your acceptable range depends on your site's architecture and user experience requirements. Trends matter more than absolute values — if Proxy Overhead is stable but Upstream Response is increasing, the issue is on your origin server.
Proxy Overhead
The average time, in milliseconds, that Smartling's GDN proxy layer spends processing a request. This portion of the total request time is attributable to the GDN rather than to your origin server.
What the GDN does during this time: When a request passes through the GDN, the proxy receives the response from your upstream server, parses the content (HTML, JSON, JavaScript, XML, etc.), identifies translatable content based on your configured rules, matches source strings against published translations, replaces source content with translated content, and returns the translated response.
What it tells you: This isolates the latency introduced by the GDN itself and helps distinguish between proxy processing time and origin server performance.
What influences this number:
- Payload size: The single biggest driver of proxy overhead is the size of the content being parsed. Large JavaScript sections (1MB+), large JSON responses, and content-heavy HTML pages all require more processing time. Sites with large payloads across many content types may see the highest overhead.
- Number and complexity of proxy rules: Each configured rule (content extraction patterns, URL matching, JSON path rules, etc.) adds processing time. Sites with many custom rules may see higher overhead.
- Content type mix: HTML pages with straightforward text are the fastest to process. JSON responses, JavaScript bundles, and XML payloads may require additional parsing steps.
- Payload size: The single biggest driver of proxy overhead is the size of the content being parsed. Large JavaScript sections (1MB+), large JSON responses, and content-heavy HTML pages all require more processing time. Sites with large payloads across many content types will see the highest overhead.
What is a good number: Proxy overhead in the range of 05–60ms is typical for most GDN customers. The exact figure depends on your site complexity and the volume of translatable content:
| Proxy Overhead | Typical Scenario |
|---|---|
| Under 10ms | Sites serving small, clean payloads (compact API responses, lightweight HTML) — includes many high-traffic production sites |
| 10–30ms | Where most GDN production sites fall — standard content pages with typical proxy rule sets and moderate payload sizes |
| 30–85ms | Sites with larger payloads (sizeable JS bundles, large JSON responses, content-heavy HTML), extensive proxy rules, or multiple content types requiring parsing |
| Over 85ms | Above the 90th percentile — typically driven by very large payloads (1MB+ JS or JSON), high rule complexity, or a combination of both |
What to look for:
- Stable or slowly increasing: Normal. As your site adds content and translations, overhead may increase on certain pages or requests.
- Sudden increase (20%+ over a short period): Evaluate based on the absolute change in milliseconds, not the percentage. A jump from 60ms to 85ms shows as a +41% change, but is only a 25ms change — well within normal fluctuations. A jump from 80ms to 160ms is a more meaningful signal. Common causes of increases include configuration changes, a shift in the content mix being served (e.g., more traffic to content-heavy pages), or a change on your site that altered how content is delivered (such as a new API endpoint returning larger payloads). If overhead increases significantly in absolute terms and does not stabilize within a few days, contact Smartling support to investigate.
- Overhead is a large percentage of total request time: If proxy overhead represents more than 40–50% of total request time, it may simply mean your origin server is very fast. Evaluate based on the absolute overhead value, not the ratio.
Upstream Response
The average time, in milliseconds, your origin server takes to respond to requests forwarded by the GDN. This measures how long your backend takes to deliver content for Smartling to process and serve.
What it tells you: This reflects your own infrastructure's performance. The GDN measures this time but does not control it. If Upstream Response is high or increasing, the bottleneck is on your origin server, not within the GDN.
What influences this number:
- Origin server performance: Application server load, database query times, server-side rendering, and caching effectiveness all directly impact this metric.
- CDN and caching configuration: If your origin server sits behind a CDN, cache hits will be very fast while cache misses require a full round-trip to the origin.
- Server-side changes: Deployments, infrastructure updates, database migrations, or increased load on your servers can all affect response times.
What is a good number: Upstream response times vary enormously across GDN customers — from under 60ms to over 1,500ms — because they depend entirely on your infrastructure. The following ranges provide general context
| Upstream Response Time | General Assessment |
|---|---|
| Under 100ms | Excellent — well-cached or highly optimized origin |
| 100–300ms | Good — typical for most web applications |
| 300–700ms | Acceptable — may indicate a content-heavy application or cache misses |
| Over 700ms | Worth investigating — may indicate server performance issues, slow database queries, or missing caching layers |
Important: Changes in upstream response time are not caused by the GDN. If this metric increases, the investigation should focus on your own infrastructure: recent deployments, server load, CDN configuration, or third-party service dependencies.
HTTP Response Code Alerts
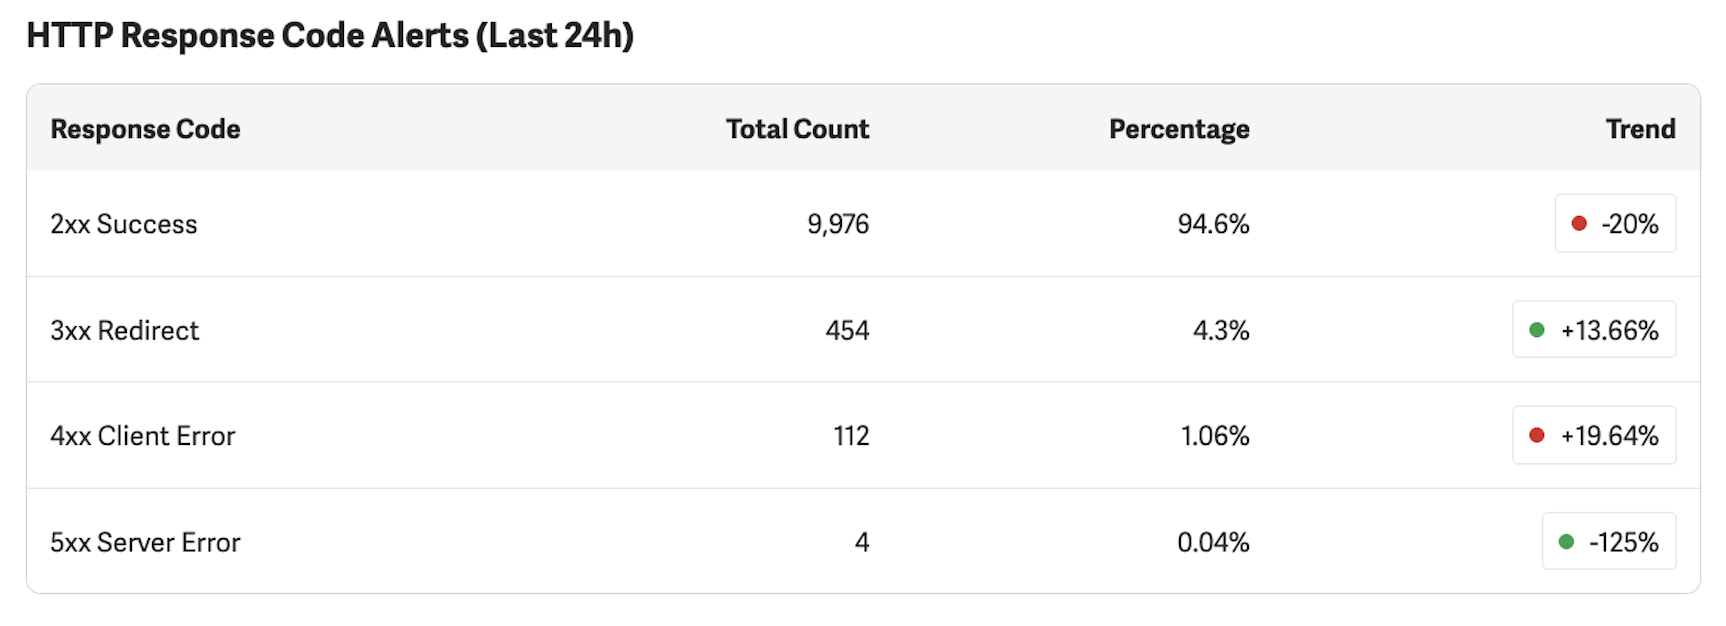
This table breaks down requests from the past 24 hours by HTTP response code category. Each row shows a Total Count, a Percentage of overall traffic, and a Trend compared to the previous day.
The Trend indicator shows the percentage change compared to yesterday. A green indicator represents a favorable change and a red indicator represents an unfavorable change. Whether an increase or decrease is favorable depends on the response code category. For example, an increasing 2xx rate is positive, while an increasing 5xx rate is negative.
The response codes shown in the Status Monitor originate from your upstream server. The GDN passes these through to the end user — it does not generate them. Understanding this is important: if you see elevated error rates or high redirect counts, the cause is in your own infrastructure, not in the GDN.
2xx Success
Requests that were successfully served. This is the most important row in the table.
What is a good number: A 2xx rate of 60–96% is typical for GDN production sites, depending on how your site handles redirects and how much bot traffic reaches the proxy. Sites with extensive URL routing or redirect logic will naturally have a lower 2xx percentage because a larger share of traffic is classified as 3xx. A sudden or significant drop in the 2xx rate warrants investigation — check which other category is increasing. A red trend indicator on this row means your success rate decreased and should be reviewed, especially if it is a large drop.
3xx Redirect
Requests that resulted in a redirect response. Some level of 3xx traffic is normal. Redirects are commonly used for HTTPS upgrades, canonical URL enforcement, and locale-based routing.
What is a good number: A 3xx rate of 1–17% is common for GDN production sites. Sites that have undergone URL restructuring, content migrations, or that use redirect-based routing may see higher rates. Stability is key — a sudden spike may indicate misconfigured redirect rules or a redirect loop.
Optimization opportunity: Each redirect adds a round-trip to the page load experience. If your redirect rate is high, reviewing your redirect chains for unnecessary hops can improve page load times. Common areas to check include legacy URL patterns that could be updated at the source, multi-step redirect chains (A → B → C) that could be collapsed into a single redirect (A → C), and pages that are consistently redirected where the canonical URL could be updated in internal links.
4xx Client Error
Requests that resulted in a client-side error, most commonly 404 Not Found responses.
What is a good number: Under 5% of total requests is typical for most GDN production sites. Some level of 4xx responses is expected on any website due to broken external links, outdated bookmarks, and bot traffic probing non-existent URLs. Rates significantly above 5% often indicate elevated bot or automated scanning traffic rather than a site health issue. A rising trend may indicate broken links introduced by a site update, a removed section of content that still has external links pointing to it, or bot traffic probing for common vulnerability paths.
5xx Server Error
Requests that resulted in a server-side error from your origin server.
What is a good number: Under 1% is typical for most GDN production sites. Intermittent 5xx responses happen on virtually every web server. Under normal conditions, the majority of production sites maintain a 5xx rate below 0.5%. A sustained rate above 2%, or a sharp increase, suggests a problem with your origin server that should be investigated promptly. The GDN does not generate 5xx errors — these always originate from your upstream infrastructure.
Understanding Trend Indicators
The Status Monitor shows a percentage change (e.g., "+24.51% vs last month") for each metric, comparing the current period to the previous period.
Look at absolute values, not just percentages. Percentage-based trends can be misleading when the underlying numbers are small. For example, if your 4xx error count goes from 6,000 to 10,000 out of 8.8 million total requests, the trend will show approximately +67% — which looks alarming. But the actual change is from 0.07% to 0.11% of total traffic, which is negligible in practical terms. Similarly, a proxy overhead change from 61ms to 86ms shows as +41%, but the absolute change is 25ms — well within normal fluctuations.
Consider both components of total request time. If total request time increased, check whether the change is driven by upstream response time, proxy overhead, or both. A total request time increase driven primarily by upstream response time indicates a change in your own infrastructure, not in the GDN.
When to investigate further:
- Proxy overhead consistently above 150ms with an upward trend
- A sharp, sustained increase in 5xx server errors (above 1% of total traffic)
- An unexplained and significant drop in total request volume
- Total request time consistently above 1 second
For all other fluctuations, periodic review is sufficient. The Status Monitor is designed for proactive monitoring — not every change requires immediate action.
Reading the metrics together
The metrics on the Status Monitor pages are most useful when interpreted together rather than in isolation.
High AVG Total Request Time + Low Proxy Overhead + High Upstream Response: The GDN is performing normally and the latency is originating from your source site infrastructure.
Rising 4xx rate + Stable 2xx rate: You may have broken links or content that was removed without redirects. Review recent site changes.
Falling 2xx rate + Rising 5xx rate: Your origin server is returning errors. This may also appear as an Unhealthy status in the System Health section.
Large drop in Requests Last 24h + No change in error rates: Traffic may have dropped due to normal variation, a marketing change, or a DNS or routing issue upstream of the GDN.
When investigating issues, use the Trend column to identify what is changing and compare Proxy Overhead with Upstream Response to determine whether the issue originates within the GDN or in your own infrastructure.
Quick Reference
| Metric | What It Measures | Typical Range | Controlled By |
|---|---|---|---|
| Requests | Total HTTP requests through GDN | Varies by site — watch the trend | Traffic patterns, bots, crawlers |
| Avg Total Request Time | End-to-end processing time | 100–500ms typical | Your server + GDN proxy |
| Proxy Overhead | GDN processing time only | 5–60ms typical | Site complexity, payload size, rule count |
| Upstream Response | Your origin server response time | Varies widely (50–800ms) | Your infrastructure |
| 2xx Success | Successful responses | 60–96% | Your server |
| 3xx Redirect | Redirected requests | 1–17% common | Your server's redirect rules |
| 4xx Client Error | Invalid requests | Under 5% | Broken links, bots, outdated URLs |
| 5xx Server Error | Server failures | Under 1% | Your server |